Showing posts with label Bobbleheads. Show all posts

Tuesday, June 15, 2021

Have I got news for you!

An exciting announcement: some of my recent research was the subject of a news article on Sportico.com where I was interviewed for some sounds bites.

Wednesday, June 2, 2021

New Published Articles

Dear readers,

I have taken a short break (as I am wont to do from time-to-time) to focus on some research. I am happy to now announce the fruit of this labour:

First, "Doping in Sports: A Compliance Conundrum" has been included as a chapter in the textbook The Cambridge Handbook of Compliance. It is chapter 65 of 69, which leads me to believe they followed the age-old adage, 'save your best for [almost] last.' (I will update the link with a version of the text if/when I can find one).

Second, "Stadium Giveaway Promotions: How Many Items to Give and the Impact on Ticket Sales in Live Sports" has been published (online) at the Journal of Sport Management. Avid readers will find it takes a familiar spin on the bobblehead topic I have been taking about ad nauseum

Thank you for all your support and stayed tuned for more research updates and (most importantly) future posts on Sports and Economics (in that order).

Jeffrey

Monday, March 2, 2020

Bobbleheads 2020

It's the most wonderful time of the year!

Players have reported to camp, pitchers are stretching out, and Spring Training is underway.

But the best part is that teams have announced their 2020 promotional schedules which gives way to the question: has Major League Baseball begun to appreciate the potential of the bobblehead?

Hint, the San Diego Padres may have figured it out...


There are two things team must consider when making decisions about promotional giveaways (items that I loosely consider to have a resale value of at least $10) at sporting events:
  1. Promos increase ticket sales by a significant amount; and,
  2. Promos allow the team to charge more for tickets.
To understand the promotional impacts on attendance, I undertake the following steps, following the same procedure that I have done for the previous four years:
  • Scrape each team's website for their promotional giveaway schedule for 2020,
  • Parse through the text of each schedule to identify dates with promos such as:
    • replica World Series rings;
    • collectible coins;
    • collectible pins; and
    • Bobbleheads!
  • Predict attendance at each game with and without a hypothetical promo using a simple regression model,
  • Choose the best dates for which promos would provide the most value to the team; and,
  • Compare my hypothetical promo schedule to the actual promo schedule and estimate the additional revenue from my promo schedule.
There are currently 223 promo days scheduled for the 2020 MLB season. While a few teams either have not yet published their promotional schedule or are not offering meaningful promotions this year (Miami and Colorado), 2020 should ultimately feature a similar number of promo days as we are accustomed to seeing.

In 2020, the model says there are 172 games that have been sub-optimally chosen to feature a promo. I therefore reassign 77% of promo days (172/223) and find that the entire league may be foregoing ticket sales to the tune of ...

... $6.4 million!

Here's this years number in some historical context.

Year   Total Promos   Reassigned Promos   Forgone Revenue ($)
             
             
2016   232   166   3.2M
             
2017   231   170   4.0M
             
2018   254   185   3.8M
             
2019   227   180   5.0M
             
2020   223   172   6.4M
             

As seen in past years, the St. Louis Cardinals, Los Angeles Dodgers, and Chicago Cubs lead the league in terms of foregone revenue, but an appearance at the top of the list of losers is largely in part due to the fact that these teams have either a) above-average number of promos; or, b) above-average ticket price (i.e., Chicago Cubs).

Excluding the aforementioned clubs without promos, the San Diego Padres had the least foregone revenue. This is partially because of their more reasonably priced tickets (3rd cheapest in the league) but also because the two games they chose to feature promos were ranked the 4th and 5th best options by the model: the model chose to reassign the promo games but picked games that would sell only ~109 more tickets each.

Way to show them how it's done, Padres!

Below are the results for each individual team. How did your team do?        
  Team   Total Promos   Reassigned Promos   Forgone Tickets (#)   Forgone Revenue ($)
                   
                   
1 St. Louis Cardinals   19   13   34,635   1,230,942
                   
2 Los Angeles Dodgers   18   15   20,469   872,393
                   
3 Chicago Cubs   7   6   14,007   833,292
                   
4 San Francisco Giants   6   5   13,562   519,681
                   
5 Milwaukee Brewers   20   11   18,055   513,493
                   
6 Atlanta Braves   18   15   14,224   418,746
                   
7 Washington Nationals   10   9   5,630   248,415
                   
8 New York Yankees   8   6   4,910   233,829
                   
9 Toronto Blue Jays   8   7   7,631   226,562
                   
10 Boston Red Sox   3   3   2,604   154,445
                   
11 Philadelphia Phillies   5   4   3,650   131,529
                   
12 New York Mets   11   8   4,743   130,916
                   
13 Minnesota Twins   6   5   3,277   107,104
                   
14 Houston Astros   5   4   1,822   90,822
                   
15 Seattle Mariners   4   4   2,165   81,762
                   
16 Chicago White Sox   5   5   2,401   68,133
                   
17 Pittsburgh Pirates   10   8   2,861   65,253
                   
18 Texas Rangers   4   3   2,281   58,740
                   
19 Cleveland   6   4   1,776   55,344
                   
20 Cincinnati Reds   11   7   2,468   52,175
                   
21 Baltimore Orioles   9   5   1,618   48,465
                   
22 Tampa Bay Rays   8   7   2,144   48,314
                   
23 Los Angeles Angels   4   4   1,545   47,773
                   
24 Arizona Diamondbacks   5   4   1,492   31,132
                   
25 Detroit Tigers   6   4   1,076   30,461
                   
26 Oakland A's   3   3   1,116   27,127
                   
27 Kansas City Royals   2   1   774   25,433
                   
28 San Diego Padres   2   2   217   4,818
                   
T-29 Colorado Rockies   0   0   0   0
                   
T-29 Miami Marlins   0   0   0   0
                   
  Total MLB   223   172   173,153   6,357,099

Friday, November 1, 2019

How to Pump Up Your Bobblehead Revenue: it’s not a question of when, but of how many

As you have come to know by now, there is perhaps no subject I am better versed in than the bobblehead.

I have argued ad nauseam about how Major League Baseball (MLB) teams are not revenue maximising when it comes to scheduling which home games will feature the cherished novelty. 

And while I have suggested that teams are losing out on as much as $5 million on this inefficiency in 2019 only, I now have evidence to suggest that teams are leaving even more money on the table by offering the wrong number of bobbleheads on the days they choose to offer them.


Scarcity is the concept that there are finite resources yet possibly infinite desires. It is the decisions and actions made by individuals in the face of scarcity makes up the very root of the study of economics. In the supply and demand framework, an item's scarcity impacts it's supply and thereby it's price.

Alternatively, scarcity bias in behavioural economics suggests that individuals value a good more if they perceive it to be scarce. Mixed with human's inane sense of loss aversion, or Fear Of Missing Out (FOMO), scarcity can be used to induce demand. Think of the times you have heard the phrase 'Act Now' or 'Limited Time Only' or the McDonald's McRib.

Major League Baseball teams have been known to use scarcity on their promotional giveaways to induce demand for tickets. You will see conditions attached to their promotional giveaway schedules such as "first 20,000 fans," or "while supplies last," used to signal their rareness of the item. While teams may deploy various strategies, one thing that becomes clear is the 20,000 bobbleheads promised by the Los Angeles Dodgers would not satiate the same share of fans as it would if promised by, say, the Miami Marlins: 20,000 bobbleheads would imply on average 40% of Dodgers fans get one, while nearly every Marlins fan could have two.

I calculate the probability of a consumer receiving a bobblehead as the number of bobbleheads promised divided by the capacity of the stadium. If a team does not provide a number of bobbleheads, I assume they plan to give everyone a bobblehead, or that the probability is 100%. Below is a histogram of these probabilities.


What can be observed from this histogram is that there is a slightly skewed distribution of the probability of receiving a bobblehead, with a giant spike at 90-100% (note that no team signaled what could be interpreted as 'false' scarcity - a limit of bobbleheads that is greater than it's capacity - although it could be a very interesting strategy). Ignoring the 100% values, the average bobblehead day sees a 40% probability a fans receives one. Including the 100%, the average is closer to 50%.

To determine what sort of effect the scarcity generates in ticket sales, I create a model to predict the paid attendance at MLB games during these years. Similar to other studies by yours truly, the unit of observation is the attendance at a single game and I include controls for the following:
  • Home team fixed effects,
  • Away team fixed effects,
  • Day of the week fixed effects,
  • Month fixed effects,
  • Year fixed effects,
  • Day/evening game indicator,
  • Divisional rival indicator,
  • Interleague indicator,
  • Opening day (team's first home game of the season) indicator, and
  • Predicted Season Wins.1
Then, if all is done correctly, the only thing I do not control for is idiosyncratic shocks and ... the bobblehead scarcity. (Yes, I understand that there are likely more things I do not control for than things that I do, but this is a free blog).

The leftover attendance that is not explained by the list of controls from above is known as the residual. If the residual is positive then the actual attendance is higher than what the model predicts. Conversely, if the residual is negative, the model predicts a higher attendance than is actually observed.

If we plot the residuals, we begin to see a pattern emerge for bobblehead days that is correlated with the probability of consumers receiving one. Computers are much better at recognising these types of patterns, so just in case you are not able to see it, I have drawn in a non-parametric line of best fit.


What this non-parametric pattern reveals is that there appears to be a local maximum at around 40%, a local minimum at around 80%, and an uptick at the 100% mark, although there is lots of variation in between. 

What is also illustrates is that perhaps a parametric approximation is appropriate - this is beneficial sa it allows us to calculate the actual value of the local minimum and maximum, as well as test what the maximum value is over the range of bobblehead probabilities [0,1]. I therefore fit a cubic function in order to test this hypothesis. This is accomplished by adding four more controls to the model described above:
  • Bobblehead Day indicator (the cubic's constant term)
  • Probability of a Bobblehead,
  • Probability of a Bobblehead-Squared, and
  • Probability of a Bobblehead-Cubed.
I graph cubic function returned by the regression below. The function tells us what percent increase in fans we should expect at a bobblehead game on the Y-axis given the probability of receiving a bobblehead on the X-axis.


The results suggest  the most fans attend when the probability of receiving a bobblehead is 38.7%. This is also known as the revenue maximising strategy and it will bring in about 13.6% more fans, all else equal. This means that 65% of bobblehead days give out too many bobbleheads.

The strategy of offering 100% is not quite as lucrative, although it is very close, bringing in about 10.5% more fans on average. Conversely, a bobblehead probability of 80.9% is revenue minimising, and it is not predicted to bring in any additional fans.

But how much does choosing the bobblehead probability actually matter? To answer this, we could calculate the change in attendance if every team chose the revenue maximising value of bobbleheads.

Similarly to how I reassign bobblehead days, I reassign the number of bobbleheads given out on the bobblehead days to 38.7%, and predict attendance. Because the predicted attendance will be higher than the observed attendance, I cap the predicted attendance at the stadium's capacity to avoid overestimating the impact.

Then I take the difference of revenue-maximising predicted and observed attendance and multiple it by the team's average ticket cost from Team Marketing Report. The end result is the forgone revenue due to an inefficient bobblehead strategy. Below is a graphical depiction with the forgone revenue from bobblehead day reassignment added for comparison (I estimated the latter back in March - see here).


The sum total of revenue gained from changing the bobblehead day schedule is approximately $16M from 2016 to 2019. But the sum total from handing out the correct number of bobbleheads is ...

$25.6 million!


A sobering thought ...

If my model is correct, most teams do not revenue maxmise when deciding the number of bobbleheads to give out on promo days. About 65% of days promise too many bobbleheads. Therefore, from 2016 to 2019, more than 4 million extra bobbleheads were handed out than would
have otherwise been suggested.

At 18cm (7 inches) in height, 4 million bobbleheads is enough to stretch from San Franscisco to San Diego!
(or, for my readers in Canada, from Winnipeg to the Paris of the Prairies, Saskatoon)

But in other not-so-fun terms, a bobblehead weighs about 700g (~1.5lbs) and a garbage truck holds 12.5 tonnes (~14 US tons) meaning MLB produced 227 extra garbage trucks worth of bobbleheads and lost $25.6 million at the same time.

While a bobblehead day can be a fun way for teams to attract fans, it has also been shown that not getting the timing and quantity correct may be quite costly and not just in forgone revenue...


[1] Predicted Season Wins is the number of wins a team can expect to end the season with given their play in prior games and the probability of winning in future games. It is calculated as the actual number of wins prior to the observation plus the expected future number of wins from the observation to the end of the season (using the moneyline odds for information on the probability of winning each future game). 

Friday, March 1, 2019

Bobbleheads 2019! And the untapped potential thereof

Once again, it is everybody's favourite time of year: Bobblehead Season!

This is one of the most highly anticipated events of the year (at least in the world of Sports and Economics) where each Major League Baseball team releases their promotional giveaway schedule. 

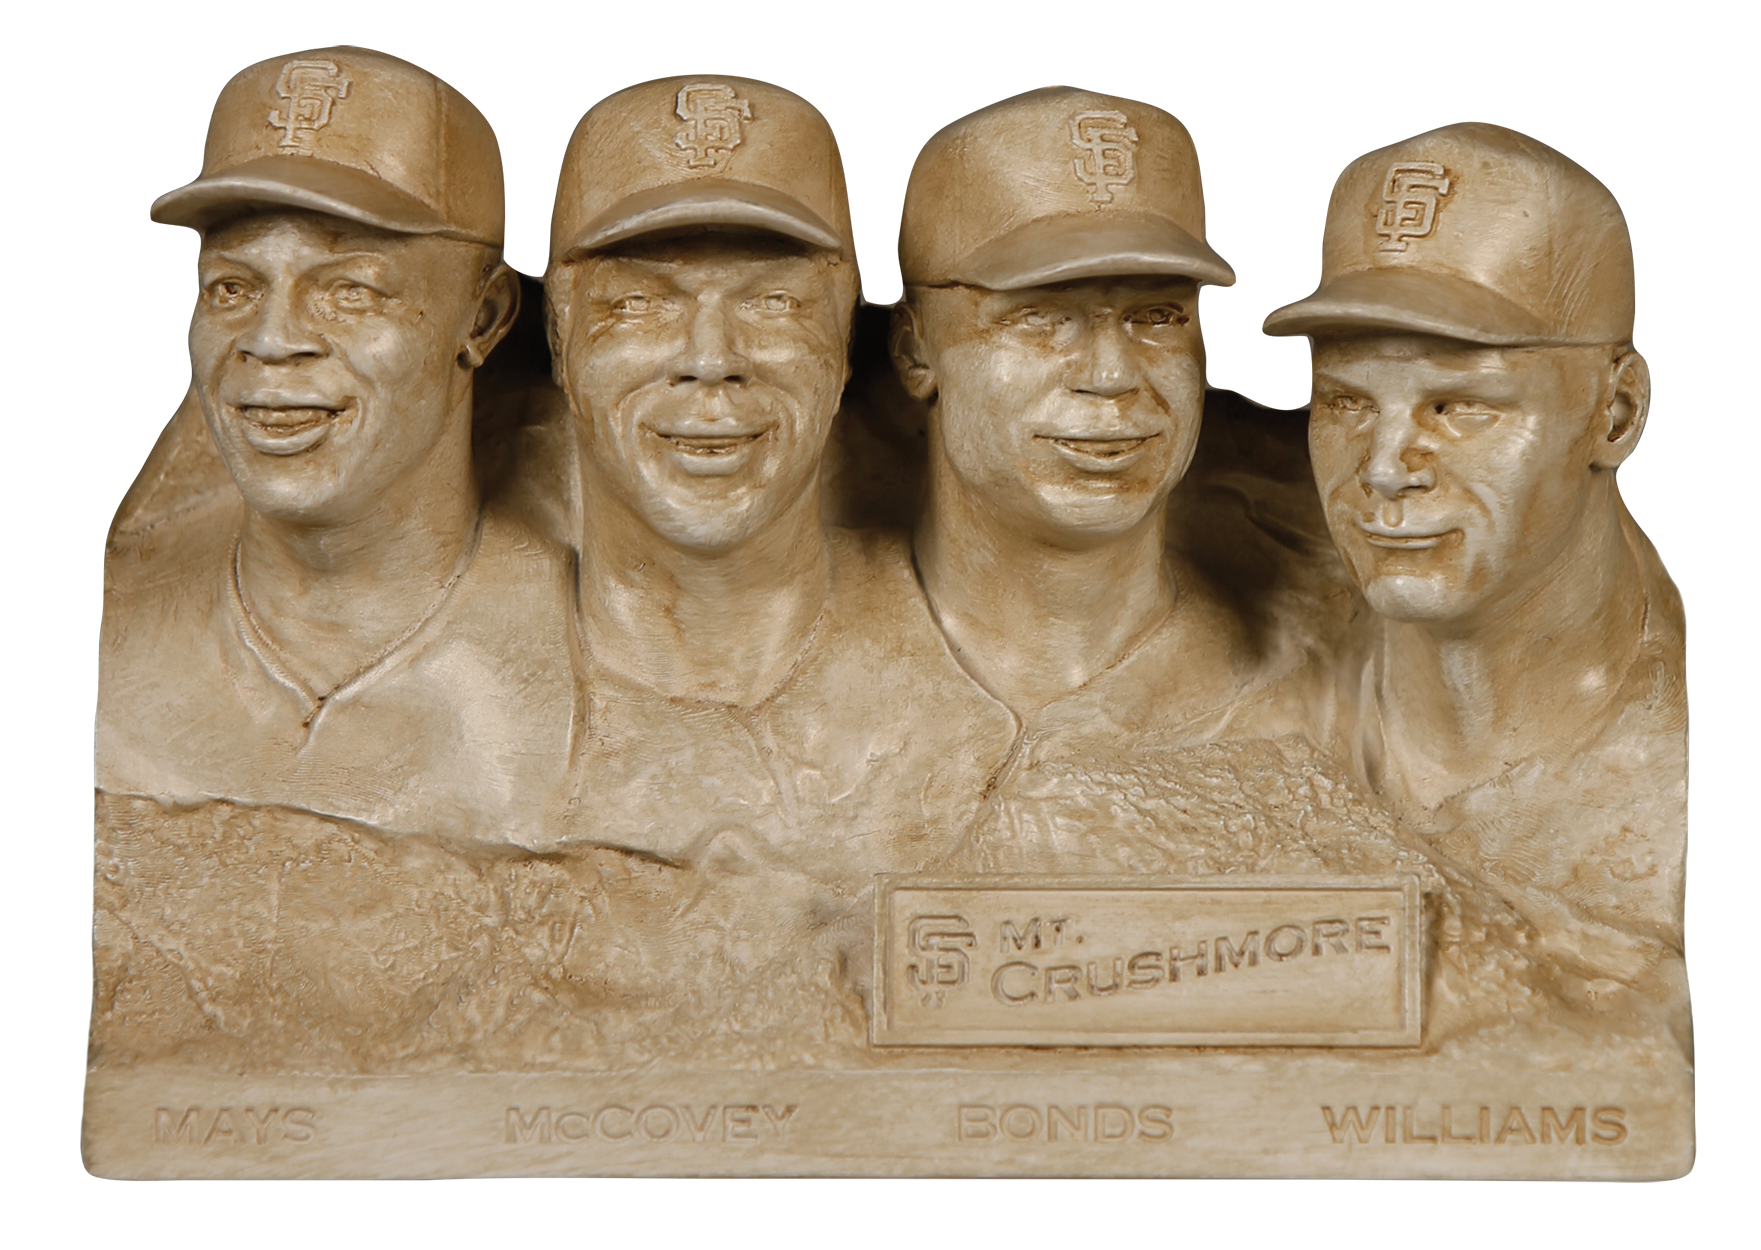
While I will not be highlighting some of my favourite promos (2018 San Francisco Giant's Mount Crushmore would be hard to beat), I will be instead going through each team's promo schedule to find the optimal days for each team to feature a promo in order to maximum revenue. 

Then I will determine which teams may be leaving money on the table.

Hint, it's all of them.


So, how do I do it? First, a couple of things you need to know about promotional giveaways at sporting events:
  1. Promos increase attendance by approximately 5%.
  2. Tickets to games featuring a promos are usually more expensive.
Similar to previous years, to predict the optimal promo schedule for each team, I undertake the following steps:
  1. Scrape each team's website for their promotional giveaway schedule for 2019.
  2. Parse through the text of each schedule to identify dates with promos such as:
    • replica World Series rings;
    • collectible coins;
    • collectible pins; and
    • Bobbleheads (!)
  3. Predict attendance at each game with and without a hypothetical promo using a simple regression model.
  4. Choose the best dates for which promos would provide the most value to the team.
  5. Compare my promo schedule to the actual promo schedule and estimate the foregone revenue to each team.
  6. Repeat steps 3-5 one thousand times in a Monte Carlo simulation.
In 2019, there appear to be 227 promo days across MLB which is in the ballpark of what we have become accustomed to seeing in previous seasons. I determine a "promo" here as a free item given to fans with an estimated resale value of at least $10.

My model finds that there are 180 games sub-optimally chosen to feature a promo, a reassignment rate of 79%! My schedule would have sold an additional 130 thousand tickets to the tune of $5.0 million!

This is the largest number in the, albeit brief, history of Sports and Economics (in that order)!

2019 - $5.0 million

Furthermore, This year, no team was optimising their promotional schedule. On the good side of things, the Detroit Tigers and the Kansas City Royals have correctly assigned half of their promo days, but are also among the eight teams to offer four or less promos for the 2019 season.

Speaking of slim offerings, the Colorado Rockies are the only team with but a single promo in 2019: a measly pennant flag freebie celebrating their 2018 Wild Card victory over the Chicago Cubs. Ironically, the Rockies still have sub-optimally chosen which to feature their one and only promo, and it will cost them about $15.6 thousand (however, relatively chump change compared to their $260 million third baseman).

On the other (bad) side of things, for the first time in our history, the biggest loser is not the St. Louis Cardinals. Similarly, the Los Angeles Dodgers have fallen out of the top three! Instead the dubious honour goes to the San Francisco Giants, who are generous enough to offer 12 promos but have picked 11 of the promo days sub-optimally. Ever since the Giants' sell-out streak ended in 2017, they have experienced much more volatility in their home-game attendance. The Giant's promo schedule, however, tends to favour days for which they are already predicted to sell out, and are therefore unable to capitalise on the increased demand for the promo days. My model suggests they are forgoing $1.2 million in ticket revenue - nearly enough to have kept their beloved Hunter Pence from signing elsewhere.

Below is the full list of forgone revenue split by team. How did your team fair?


  Team   Total Promos   Reassigned Promos   Forgone Tickets (#)   Forgone Revenue ($)
                   
                   
1 San Francisco Giants   12   11   31,114   1,191,674
                   
2 Chicago Cubs   10   8   17,881   1,047,277
                   
3 St. Louis Cardinals   14   9   19,401   689,510
                   
4 Los Angeles Dodgers   12   10   8,169   336,011
                   
5 Houston Astros   15   12   6,348   255,499
                   
6 Atlanta Braves   19   16   6,769   214,634
                   
7 New York Yankees   6   5   3,016   143,609
                   
8 Seattle Mariners   8   8   2,918   108,936
                   
9 Washington Nationals   6   5   2,578   108,327
                   
10 Milwaukee Brewers   12   9   3,062   79,925
                   
11 New York Mets   11   8   2,830   78,096
                   
12 Philadelphia Phillies   6   5   2,152   77,565
                   
13 Baltimore Orioles   4   4   2,020   60,502
                   
14 Chicago White Sox   5   5   2,212   59,125
                   
15 Texas Rangers   7   5   2,030   54,678
                   
16 Cleveland   4   4   1,807   54,293
                   
17 Toronto Blue Jays   5   5   2,036   53,086
                   
18 Boston Red Sox   6   5   898   51,168
                   
19 Los Angeles Angels   4   4   1,323   40,040
                   
20 Tampa Bay Rays   6   6   1,732   37,416
                   
21 Cincinnati Reds   10   6   1,743   36,847
                   
22 Oakland A's   4   4   1,290   31,128
                   
23 Minnesota Twins   6   4   864   28,225
                   
24 Detroit Tigers   4   2   895   25,208
                   
25 Pittsburgh Pirates   9   6   998   23,392
                   
26 San Diego Padres   4   3   1,065   23,193
                   
27 Arizona Diamondbacks   5   4   981   19,270
                   
28 Miami Marlins   8   4   533   16,924
                   
29 Colorado Rockies   1   1   599   15,591
                   
30 Kansas City Royals   4   2   451   15,154
                   
  Total MLB   227   180   129,715   4,976,303


And thus concludes another great year of analysis on bobbleheads, or does it?

Stay tuned for future bobblehead-related talk on Sports and Economics (in that order)!


PS. if you like what you are reading and want to support Sports and Economics (in that order), please feel free to comment, share, and click on some ads!